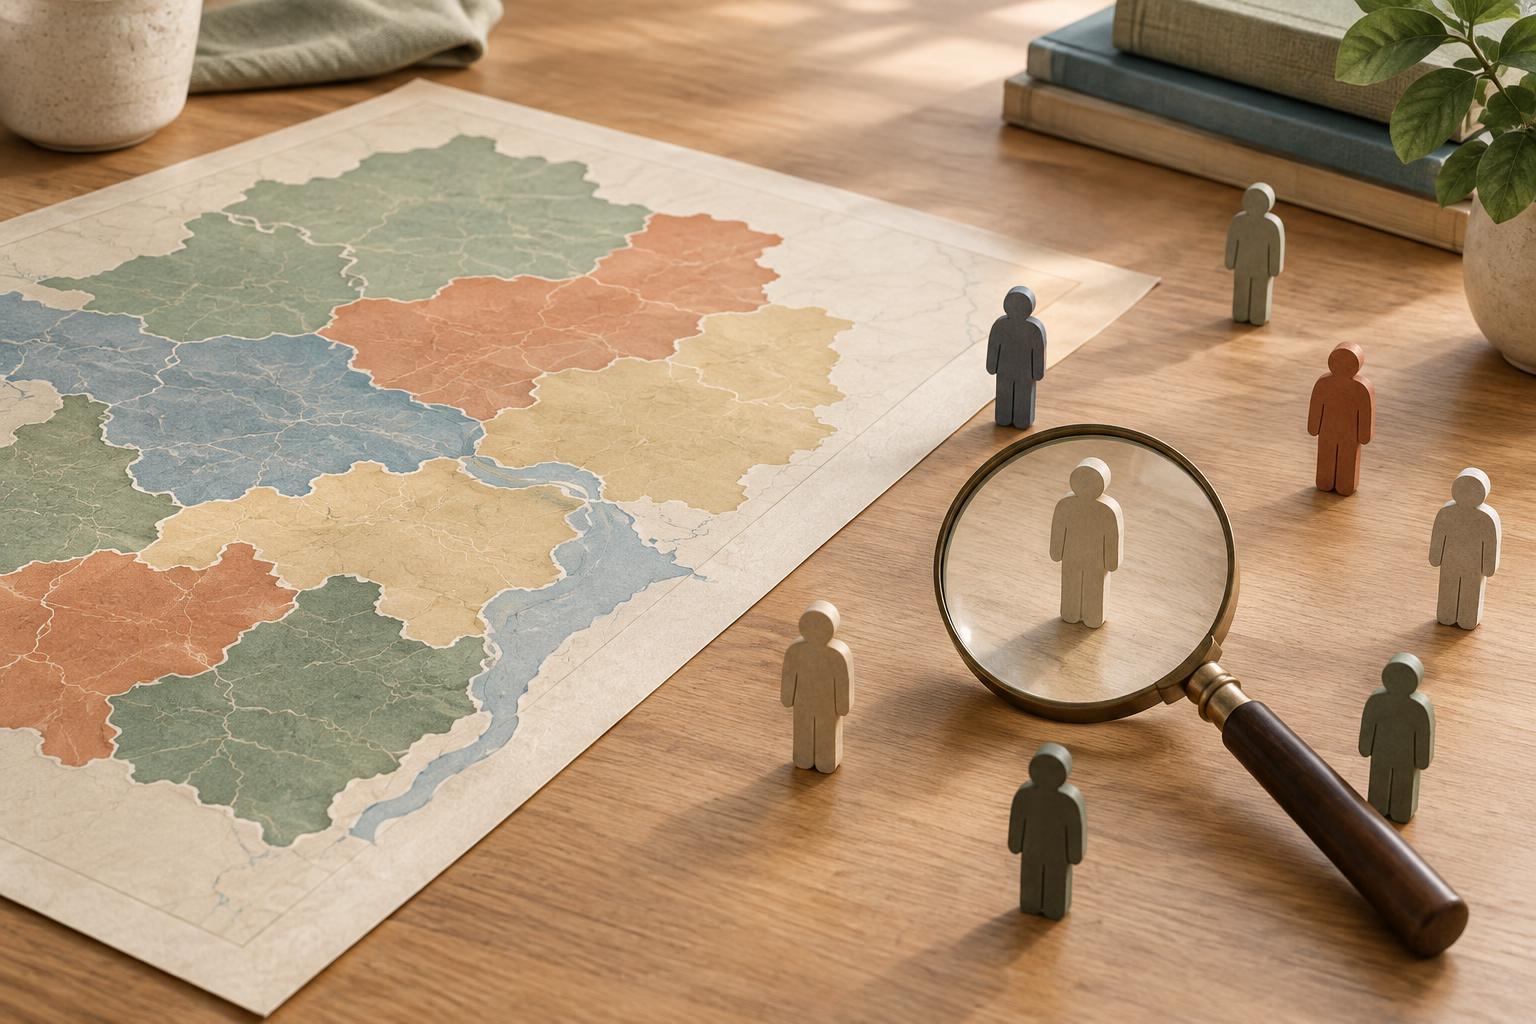
A pattern across places is not a pattern within people
Suppose districts with more renters tend to give a candidate a larger share of the vote. It may be tempting to conclude that renters favored that candidate. But district results show where votes were counted, not which residents cast them. Homeowners in those districts might have supplied many of the candidate’s votes, while renters might have voted differently or not voted at all. The district-level pattern can be real even when the proposed explanation about renters is wrong.
This is the ecological fallacy: drawing a conclusion about individuals from a relationship observed among groups. In political research, the groups might be districts, municipalities, states, schools, or countries. Group-level data can be useful for understanding differences between places. The mistake occurs when an analyst treats those differences as direct evidence of individual behavior or attitudes.
Why the inference breaks down
A group total combines people with different characteristics and choices. Election returns, for example, record votes cast in an area, while a demographic measure may describe all residents of that area. Those populations need not match. Some residents cannot vote, some do not vote, and some may have moved since the demographic data were collected. Even when the populations line up closely, the totals do not tell us which characteristics belong to which voters.
Groups can also differ in more than one relevant way. Areas with many renters might differ from other areas in age, housing costs, access to transport, or local issues. Any of these differences could help explain a voting pattern. Aggregation can hide variation within each area as well: two districts with similar results might contain very different combinations of voters. A correlation across districts therefore leaves several possible accounts of individual choices open.
Questions to ask before interpreting a map or chart
Start by identifying what each observation represents. Is each dot on a chart a person, a polling place, or an entire region? Next, check whether the measures describe the same population and period. A chart pairing current election returns with older population estimates may still be informative, but its limits deserve attention. Ask, too, whether the claim is about places or about people. “Areas with more renters gave the candidate more votes” is a different claim from “renters voted for the candidate.”
Then consider what information the chart leaves out. Does it show turnout or only vote share? Could another characteristic vary alongside the one being highlighted? Are the groups so large that important differences within them disappear? These questions do not make geographic comparisons worthless. They help keep the conclusion at the level the evidence actually measures.
What other evidence can add
Individual-level surveys can ask respondents about both their circumstances and their political choices. When designed and interpreted carefully, such data can address questions that area totals cannot answer directly. Surveys have their own limits, including inaccurate recall, nonresponse, and uncertainty about whether respondents represent the wider population. An interview may clarify how someone describes a choice, but a small set of interviews cannot by itself establish how common that explanation is.
Researchers may also use statistical methods that estimate possible individual patterns from aggregate results. Such estimates depend on assumptions and should not be mistaken for a record of each person’s vote. Where suitable data are available, comparing several kinds of evidence can strengthen an interpretation. Where they are not, it is better to state what remains unknown than to present a plausible story as a measured fact.
Make the claim match the evidence
Group-level findings can answer important civic questions. They can show where participation was higher, which regions supported a proposal, or how outcomes varied with local conditions. Those patterns may guide further investigation and raise useful questions about institutions, campaigns, and community needs. They do not, on their own, identify the decisions or motives of the people living in those places.
When writing about aggregate data, name the unit plainly and use verbs that fit it: districts reported results; people made choices. If an individual-level interpretation is only a possibility, label it as a hypothesis and explain what evidence would help test it. That small discipline makes political analysis both clearer and more honest about what its data can show.