A snapshot and a sequence
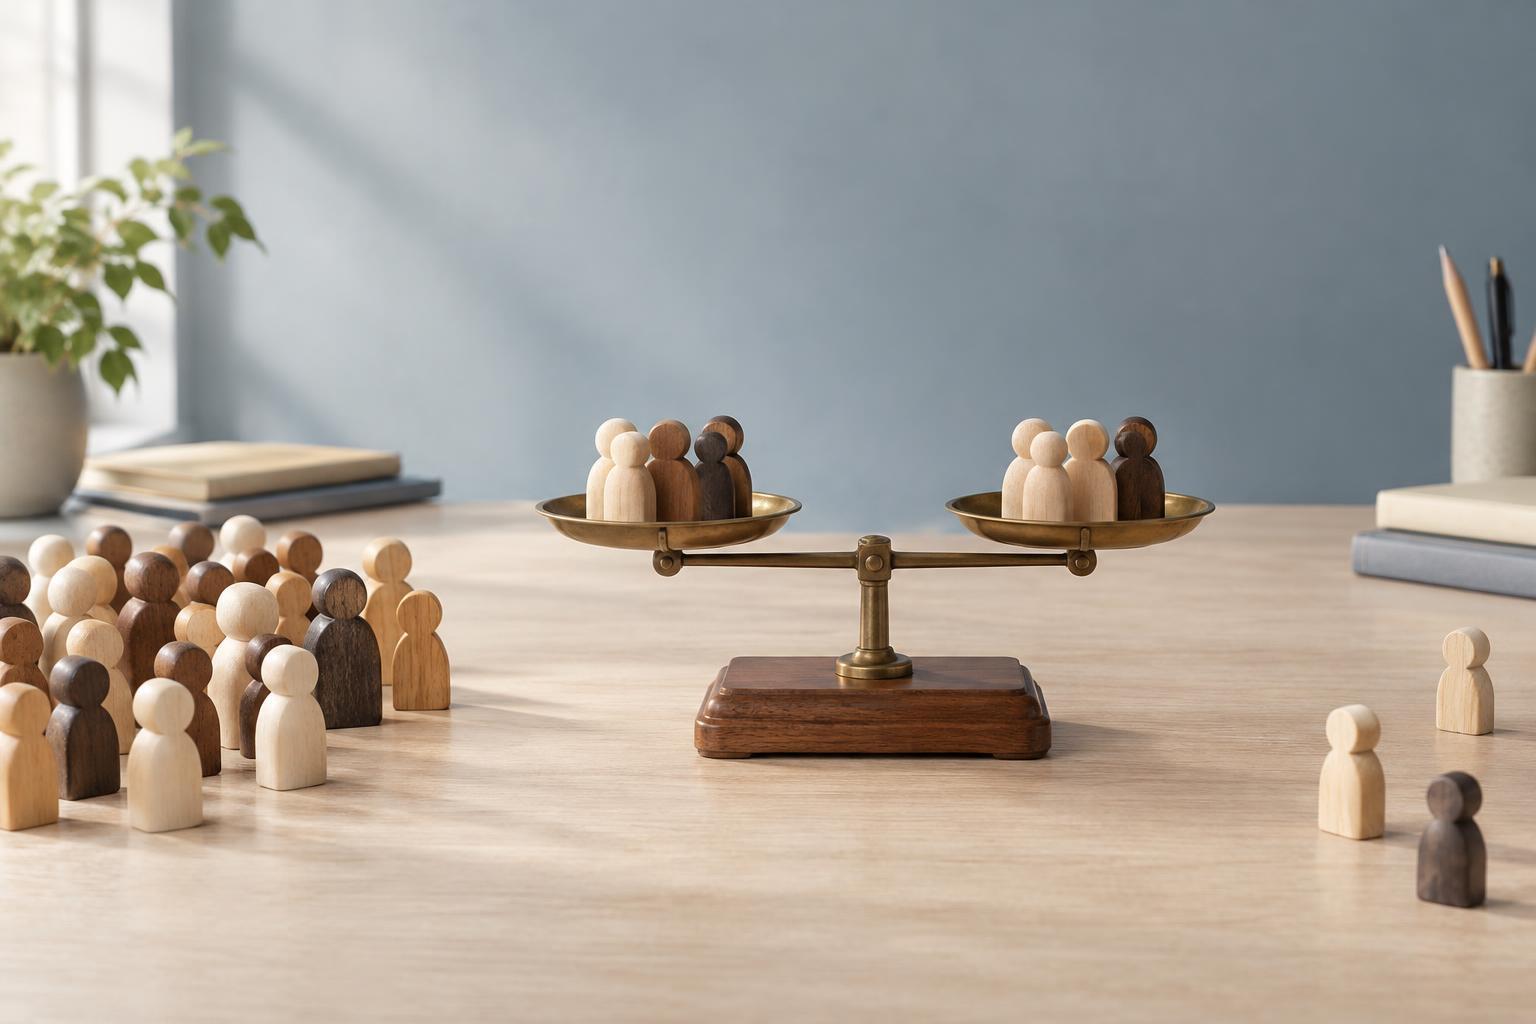
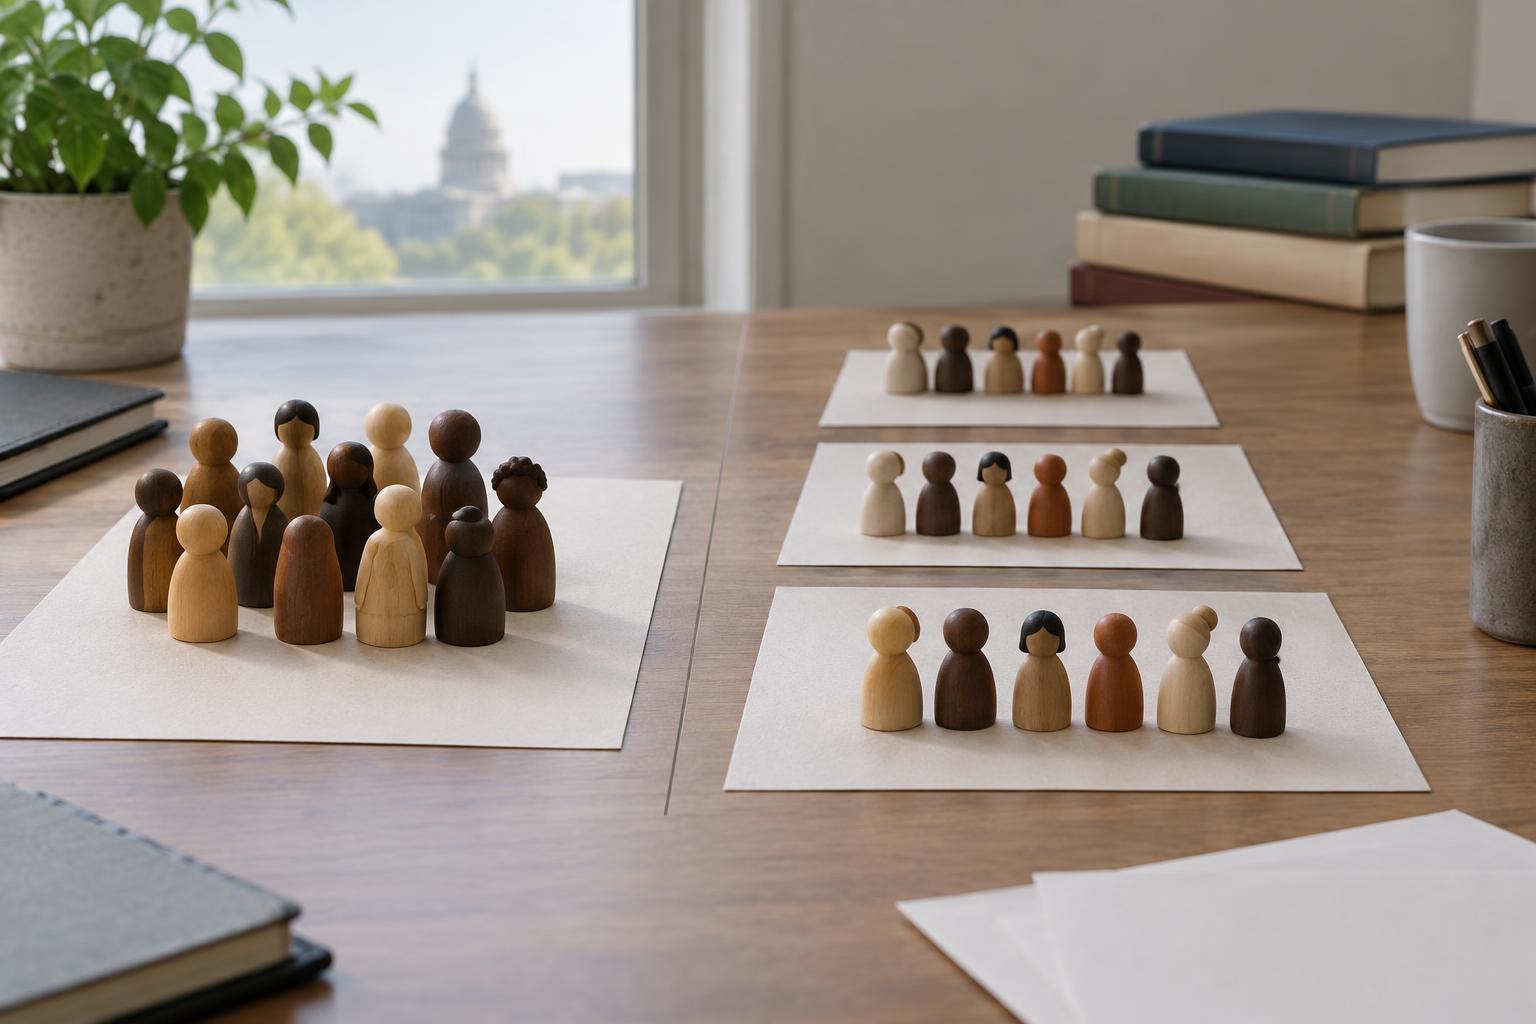
Imagine a survey asking residents whether they trust their local council. If researchers ask a group of residents once, the results are cross-sectional data: a snapshot of responses collected at roughly the same time. Researchers can compare groups within that snapshot, such as residents who attend council meetings and those who do not. They can also describe the overall distribution of answers.
Now imagine researchers ask the same residents the same question every year. Those responses form panel data. Because each person’s answers can be linked across rounds, researchers can examine who changed their view, who stayed consistent and whether change followed a similar pattern across different participants. Both designs can be useful, but they answer different questions.
What a cross-section can show
Cross-sectional data are well suited to describing a population at a particular point. A carefully designed survey might estimate how common a policy preference is or show that participation in a civic activity differs across age groups. Researchers can also look for relationships between answers: for example, whether people who report following local news also report greater familiarity with council decisions.
Those relationships require careful interpretation. If news followers know more about council decisions, the survey alone cannot establish that following news caused the difference. People who are already interested in local government may be more likely to seek out news. Other factors may influence both habits and knowledge. A single snapshot also cannot show whether a particular respondent’s opinion has changed, even if respondents of different ages give different answers.
Researchers may conduct separate cross-sectional surveys at several points in time. These repeated snapshots can show whether an overall measure rises or falls. Unless the same people are followed, however, they cannot reveal exactly who changed their mind. A shift in the average could reflect individual changes, differences in who responded, or changes in the population being studied.
What following the same people adds
Panel data make individual change visible. Suppose overall support for a proposed transit policy is nearly identical in two survey rounds. A panel might reveal that many people switched positions in opposite directions, leaving the total largely unchanged. A pair of separate snapshots would be less able to distinguish that movement from widespread stability.
Following participants can also help researchers study the order of events. They might record a person’s level of civic participation before measuring a later change in political interest. This sequence provides more information than asking about both at once. It does not, by itself, prove that participation caused the change. An unmeasured experience could affect both, and people may choose to participate for reasons the survey does not capture.
Panels have practical limits. Some participants stop responding, move away or skip questions. If those who leave differ from those who remain, later results may give a distorted picture. Repeated questioning can also affect how participants think about a topic, while changes in question wording can make answers across rounds difficult to compare.
How to read a comparison responsibly
Start by asking what the researchers want to learn. If the question is, “What proportion of residents supports this proposal?”, a representative cross-sectional survey may be appropriate. If the question is, “Which residents changed their position after the proposal was debated?”, following the same residents is more informative. Neither label guarantees quality: sampling, clear questions, consistent measurement and transparent handling of missing responses matter in both designs.
Next, check what is being compared. A graph showing different age groups in one survey compares different people, not the same people at different ages. A graph showing results from surveys in successive years may track a population trend without tracking individuals. A panel can track individuals, but its findings still depend on who entered the study and who stayed in it.
Finally, separate description from explanation. Evidence that an opinion changed after an event establishes a timeline, not necessarily a cause. Stronger explanations consider plausible alternatives and make their assumptions clear. Reading the design alongside the claim helps turn a survey result into a more precise statement about what we know—and what remains uncertain.